
Big data is more than just a trend — it’s essential to your company if you need to scale, maximize business potential and stay competitive. However, big data is “too big” for any company to leverage without the right tools.
Data visualization is the best tool for harnessing big data and transforming it into digestible, actionable information your team can use to make informed decisions. It can take the form of charts, graphs, maps, heat maps, plus more. And data visualization can transform hundreds, thousands or even millions of bits of data into graphics that humans can comprehend, analyze and draw conclusions and insights from.
If your business isn’t currently using data visualization to its full potential, you may be wondering why it matters to your business at all. Here’s a look at 5 reasons why data visualization matters — plus how it can power your business to new heights.
1. Transform Complicated Data Into Easy-to-Comprehend Visuals

Think about all the data available to your business. Now, think about all the data that your business is actually analyzing and taking advantage of on a regular basis. There’s likely a gap between the data available and the data that you’re actually using.
Data visualization helps close this gap.
You may have data related to productivity, expenses, quality control, shipments, lifetime value of clients, as well as other categories. This data is an opportunity for your company to reduce expenses, create efficiencies, and generally push the business toward reaching its full potential.
Keep In mind that there’s likely to be a gap between the data available to your company and the data that your company is actually taking advantage of. Even the biggest organizations employing huge data teams miss out on data-related insights from time to time. But, if you’re not currently using a data visualization tool at all, start small and continue expanding your visualization efforts so that you slowly start making this gap smaller.
2. Develop a Sense of What’s Normal and What’s Not
Data means nothing if you’re unable to analyze it and draw actionable conclusions. Data visualization helps you do both — analyze and draw conclusions. As you start or scale data visualization efforts, you will begin to see at a glance what’s normal for your business and what’s not.

For example, a manufacturing company is likely to know what productivity looks like data-wise when it is operating at full or normal capacity. Data visualization can help a company like this see, on a day-to-day basis, whether or not its productivity matches its investment in staff and other resources. If you’re using data visualization to monitor performance metrics like this on a daily basis, your company can make effective incremental changes and improvements over time — rather than waiting until a crisis situation necessitates drastic changes.
3. Quickly Identify Areas That Demand Attention

Using the example above, imagine that a manufacturing company is leveraging data visualization to track its productivity on a day-to-day basis.
Now, reams and reams of productivity-related data kept in a spreadsheet will require a significant amount of effort to analyze and draw useful conclusions.
However, if the same data is represented via a data visualization tool, your leadership team can quickly identify anything that looks out of the ordinary: low productivity rates, skyrocketing expenses, a significant drop in quality, delayed shipments, plus more.
These are insights that any business would want as quickly as possible — no matter the industry. The most important step is to start using data visualization so that your company can customize an IT dashboard that helps track the metrics that are most important to the bottom line.
4. Make Fast, Confident Decisions
The larger a business, the harder it becomes to take risky actions or to make decisions based on instinct alone. The stakes are simply too high.

It’s better to make decisions based on concrete and reliable data. Again, data visualization can help decision-makers quickly choose the best course of action with full confidence.
Important business decisions may include closing locations, expanding operations, reorganizing team structures, exploring new product lines, identifying ideal customers, choosing or expanding relationships with key partners, etc. These decisions are too important to make without the data to back them up.
5. Share Reporting With Important Audiences
Executives are busy to the extent that they do not have time for lengthy presentations on company performance. They need fast presentations that pack as much information as possible — and data visualization can help create those types of presentations. The right graph or chart or heat mat can demonstrate to executives why department managers are taking specific courses of action, as well as indicate when overall performance is high or needs improvement.
Most importantly, the right data visualization tool is highly valuable when making a business case to the executive. If a department manager wants to expand the team, data visualization can help make the case. The same holds true for making other requests of a company’s leadership team — data visualization can help provide the rationale and help build support.
Enterprise Performance Software: The Best Source of Data Visualization Tools
Your company doesn’t need to build its own data visualization tool. Instead, your company should seek out enterprise performance software that includes robust data visualization options so that the business can start enjoying the 5 benefits listed above.
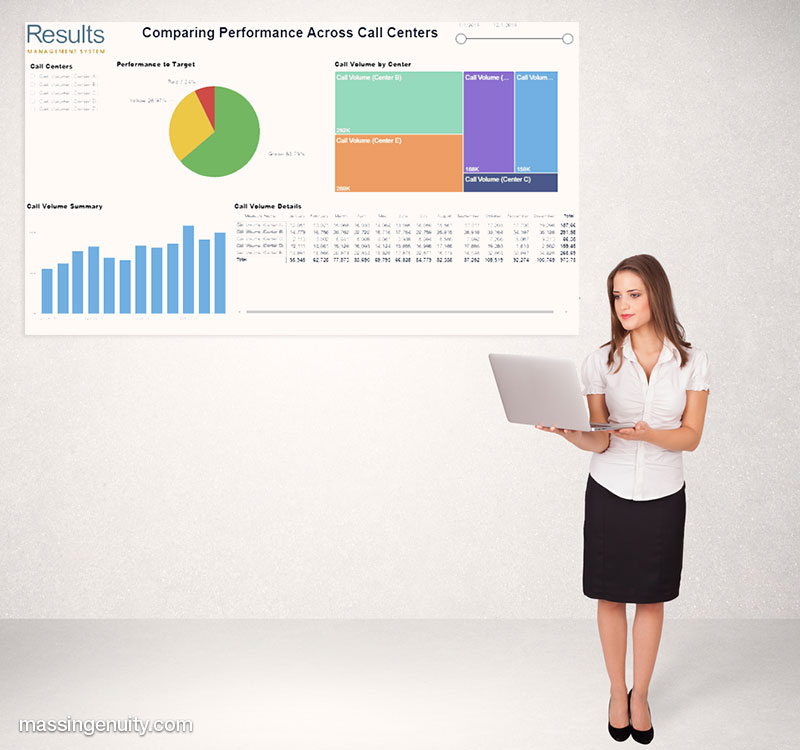
At Mass Ingenuity, our Results Software delivers industry-leading data visualization capabilities. Gain access to daily, weekly, monthly, and quarterly performance insights when you choose Results Software for enterprise performance management. Both you and your company’s executives enjoy the following when using Results Software:
- Leading indicators of success that quickly detect changes in key metrics.
- Lagging indicators of success that provide a historical perspective on performance.
- Modeling and fine-tuning tools that help your business create value.
- Consolidation of positive results for reporting and promotional purposes.
Is your company ready to unlock the power of data visualization? Get in touch to learn more about using Results Software as your enterprise performance management solution.
Scott Harra
Executive Vice President of Marketing and Government Relations