
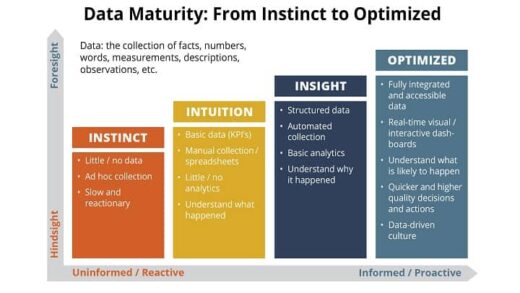
You may be drowning in data, have the wrong data, or have no data at all. But the speed and digitization of business demands rapid decision making and a willingness to break incrementalism strategy into small bits for other parts of your organization to complete.
Tracking the meaningful activities of your entire organization and visualizing it can be a benefit and speed up the completion of those important strategies. The following describes how a large organization achieved rapid and dramatic improvements based on data-driven insights. In subsequent emails, we will cover small and mid-size organizations.
In all cases the use of data to drive insightful decisions has become “mission critical.”
Making Strategy Deployment a Reality
Case Study: How a large organization drove strategic results using Results Software and data to make insightful decisions.
The Challenge and Back Story

Over the past several years, many organizations have made great strides in implementing a lean-based, data-driven performance management system. The inspiration for this work comes from the Results Management System and Software developed by Mass Ingenuity.
This story outlines how a large organization made significant progress using Results Software. The challenges were typical of an organization of 10,000 FTE geographically dispersed across 50 separate facilities.

The Work and Process
Understanding measure data is a combination of quantitative and qualitative analysis. The quantitative analysis is straightforward and easy to communicate with employees. Calculations are kept simple and technical “jargon” is minimized.
Much of the quantitative analysis focuses on measuring data trends as well as absolute status such as “red, green, yellow.”
The qualitative analysis makes use of our deep understanding of your management system, your strategic initiatives, the process improvement efforts in flight, and our knowledge of your business.
For example, while quantitative analysis might indicate several measures that are improving, it will be the qualitative analysis that helps interpret overall impact to the organization.
While it is important to improve on the process measures associated with running operations, it is critical that measures associated with employee engagement, wellness, diversity and inclusion be flagged in terms of their overall state of improvement.

Data, Insights, and Results
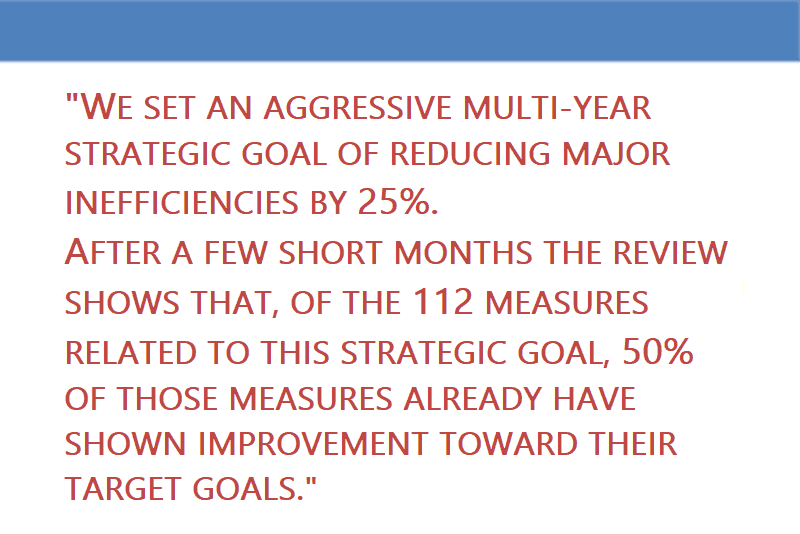
The following addresses measure data collected over an 18 month period. The organization set an aggressive multi-year strategic goal of reducing inefficiencies by 25%.
After a few short months the review shows that, of the 112 measures related to this strategic goal, 50% of those measures already have shown improvement toward their target goals.
Summary of the Trends:
- 330 measures in total were analyzed
- 174 measures improved (53%)
- 54 had no change, but 47% of these are already trending in the green
- 20% of measures improved by more than 50%
- 35% of measures improved 15% or more
- 112 measures are related to the 10-year strategic goal to a 25% reduction in inefficiencies with 50% of these measures improved