

When it comes to the manufacturing sector, data visualization primarily focuses on operations and may be of immense value not only to leadership but also to middle managers and supervisors. In other words, these are the teams that are tasked to oversee a company’s manufacturing processes. However, one common challenge among businesses operating in this industry is having many, many process measures.
Even worse, without a sound organization of these measures, manufacturers will never be able to make any sense of the data they generate and track. Without the capability to access all measures on a single dashboard page, you won’t be able to understand the story your data visualization tools tell about your performance. Here is a data visualization example to elaborate on this point.
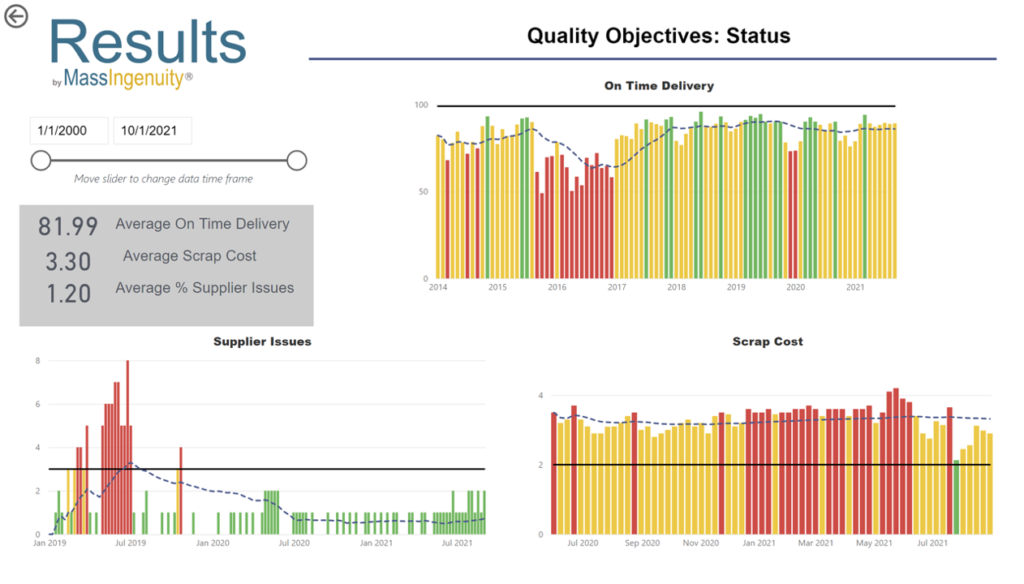
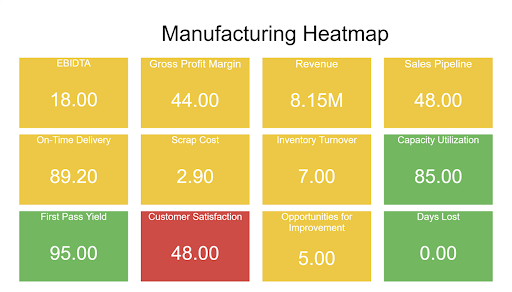
Imagine your dashboard displays five core processes in your manufacturing company. As you without doubt know, a manufacturer has to perform at a high level to be successful. Therefore, imagine these five core processes represent a total of 112 measures that are fed into your data visualization software from multiple data sources. This data is coming from your ERP system, CRM system, along with other business intelligence applications you routinely use.
All this information flows seamlessly into your dashboard. Back to the five core processes, imagine that three of them are highlighted in red. To this end, we might say 35% of your process measures are in red. This, by itself, will draw your attention quickly. More importantly, by simply viewing the data displayed, you can then immediately understand what the problem is with those three measures.
This way, data visualization can furnish you with a means of seeing the bigger picture rapidly. With good data visualization tools, you can drill down to those measures in a flash and peruse the summaries attached to them, allowing you to see the right information on a single page, see its exact composition, and even to zero in on the trouble spots.
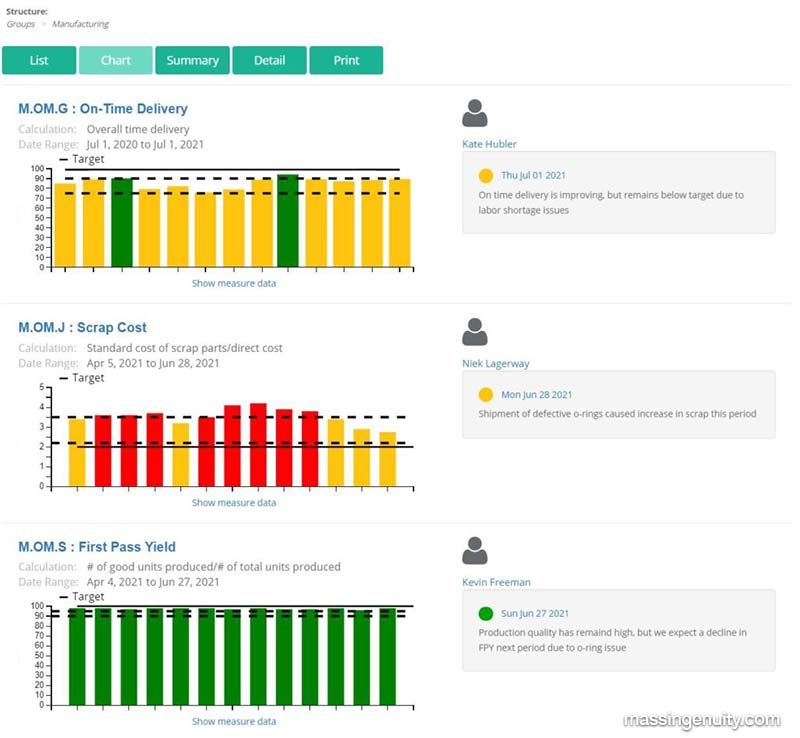
You’ll be able to rapidly identify which specific work cells are problematic since all your process measures are being pulled up in your dashboard via your ERP system, at the work cell level, and on the factory floor. Best of all, armed with this real-time information, you and your team will be in a good position to take immediate corrective actions involving the current shift supervisor prior to the next shift starting.
The moment you obtain all the information you need concerning the three problematic process measures, you can then take action. In this case, it will be mobilizing the people who are accountable for those processes, make data-driven decisions, and ultimately initiate the necessary improvements. It is noteworthy to mention that you won’t be obligated to resolve the issue ASAP. Rather, you and your team will be able to move very quickly into action mode and task the people involved in the concerned work cells to do what’s necessary. Another important factor to always consider is that all employees involved can access the right information to execute their duties through your data visualization tool.
This is extremely important, since if they cannot see it how can they manage it effectively?
In turn, this clearly demonstrates the power of data visualization, because the right information isn’t buried in Excel sheets, an ERP system, or even an HRIS system. The data you and your team access will instead be pulled from multiple sources. Once this is done, it will then be modeled in a manner that easily helps you to rapidly determine and analyze issues, allocate resources and eventually take action to drive improvements and shorten the improvement cycle. One of the most critical outcomes of data visualization is driving improvement and executing at a high level.
Results Software is one of the foremost enterprise performance management tools on the market. Its data visualization and reporting capabilities may be exactly what the doctor ordered to streamline your manufacturing processes and drive continuous improvements in your core operations. You are just a call away from fast-tracking your manufacturing company’s performance, give us a call today at 877.669.3308!
Jim Clark,
Vice President Professional Services