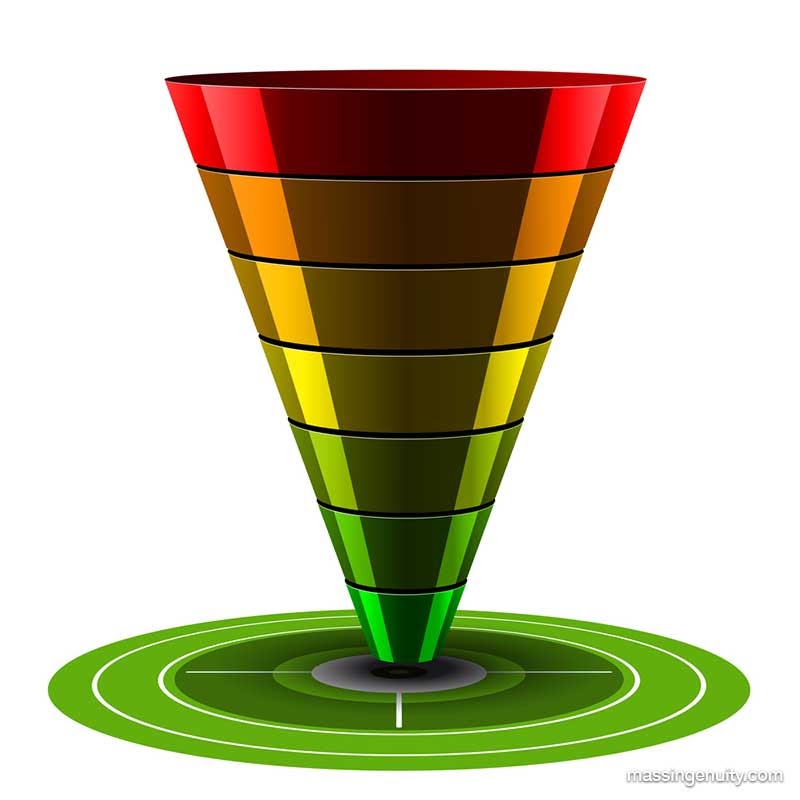
Tracking and displaying your company’s sales activities is an extremely powerful tool for achieving your revenue goals. In order to use your sales data more effectively, you first have to ensure that you and your team are measuring the right metrics. In other words, they need to be relevant to the sales process. Essentially, the most suitable enterprise performance management metrics ought to help you evaluate each team member’s tasks and activities in the context of how they contribute to your company’s overall goals.
Generally speaking, you probably have a number of high-level success metrics you measure your business against. However, you may be making one or more of these mistakes:
- You may not review your measures frequently enough to make changes that enable better results
- You may not have the early warning signs of trouble (i.e., “yellow” and “red” thresholds)
- Sales data may be seen only by a couple team members and are not transparent to every one who impacts the sales process
- You may be measuring too many metrics and causing too much distraction
- Reliance on a CRM database may make report generation difficult and may be too activity-based, rather than actually providing valuable insights such as results

Your Sales Dashboard Measures
You now have a powerful tool for forecasting, tracking, and reporting your sales performance measures. The Sales Performance Measurement tool can be used by an individual salesperson or by a team of salespeople.
Since the sales process is a funnel, sales performance measures enable sales managers to determine which parts of their funnel need improvement. In reverse order of the sales funnel, there are five key metrics included in your tracking tool. (Note: An Outcome Measure is the lagging indicator of success while the Process Measures are the leading indicators of success.)
Outcome Measure 1: Sales Revenue Booked
Essentially, overall sales revenue is one of the most important performance indicators sales managers keep track of in measuring the overall performance of their sales team. Gross income is a fairly simplistic sales data metric that involves assessing just how much revenue a company generates within a specific timeframe, less other associated variables like discounts or returns.

Process Measure 1: Sales Win Rate
By examining your sales team’s closing rate you will be able to better determine why a customer was lost.
This data will go a long way in helping you to gain a deep understanding of why your existing sales process failed to close this segment of prospects and allow you to make the necessary improvements. Measuring closing rates will help you to accurately appraise your sales process and the root cause(s) of shortfalls.
For example, by actively monitoring your sales conversion ratio, you and your team learn valuable lessons for the next opportunity in the sales funnel. For example, was there an objection that could have been handled better, or worse, was never fleshed out with the prospect. On the other hand, measuring closing rates can also help you figure out whether your sales team is contacting the ideal leads.
Process Measure 2: Proposals Under Negotiation
If a prospect is actively negotiating the terms and conditions of your team’s proposal, that is a good indication the proposal is compelling and your company has a good shot at winning. On the other hand, if prospects are not engaged in the negotiation then your team does not know the objections and concerns. It’s the old adage, “A sale doesn’t occur until objections are raised.”
Process Measure 3: Proposals Submitted
Customer proposals (or quotes) are the lifeblood of the sales process. If your company is not submitting proposals to new or existing customers, then an upstream problem exists in the sales funnel. The problem could be that your sales team doesn’t know how to make a sufficiently compelling value proposition to the prospect. Or, the competition moved faster than you and your team did. Or, there could be unresolved product or service issues that is tainting your company’s reputation in the market.

Process Measure 4: Prospect Calls and Presentations
We all know that sales is a numbers game. If your company’s sales win rate is typically 20%, that means your team needs to hold 100 prospect meetings and presentations to hit your target of 20 new sales.
If you only hold 50 prospect sessions, then you may only close 10 new sales.
Getting Started
Using your sales performance data is very important to improving results. Creating a data-driven culture with a sales team takes commitment, transparency, and accountability. We recommend that you define your sales performance measures with your team so you get their input and buy-in. It will also help you and your team to clearly figure out sales processes that promote or inhibit your sales team’s effectiveness.
Please use this link to access your free Results Sales Performance Measurement Tool today and immediately start expanding your data-driven culture.
Lastly, Mass Ingenuity can also provide you with best practices for assessing your data and reporting on it during weekly, monthly, and quarterly checkpoints. We can structure your checkpoints with sample agendas, meeting best practices, and decision-making tips.
